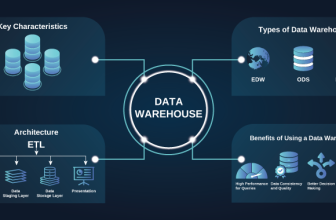
What Is Data Analytics? Tools, Benefits & More

Data analytics is the process of evaluating, segregating, and interpreting raw data for hidden patterns and meaningful insights to make informed decisions. It is a purposeful upgrade built on ML and statistical analysis that aims at improving business intelligence, predicting trends, and optimizing processes.
What Exactly is Data Analytics?
Data Analytics is the systematic study of data using computing systems to derive actionable insights into the current scenarios and make information-driven decisions. It involves collecting, storing, and processing the real-time data from multiple sources such as market research, databases, resource management systems, customer data, business reports, and so on.
-
Data Analysis
Data Analysis is a part of Data Analytics. It is a detailed examination of the data at hand to understand and interpret the patterns, causes, and outcomes.
-
Data Analytics
Data Analytics is a broader and more practical approach that utilizes examined data to predict future trends and suggest corrective actions based on the patterns, causes, and outcomes gathered through Data Analysis.
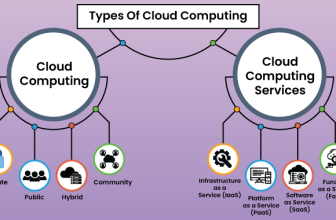
Types of Data Analytics
Here is a breakdown of the four prominent types of data analytics, namely Descriptive Analytics, Diagnostic Analytics, Predictive Analytics, and Prescriptive Analytics.
-
Descriptive Analytics
Descriptive Analytics involves identifying, sorting, and summarizing the collected data for further analysis. It represents the data using bar graphs, tables, and charts, helping companies to compare the performance, find strengths and weaknesses, and spot differences in patterns.
-
Diagnostic Analytics
Diagnostic Analytics focuses on finding the root cause of a problem using tools such as correlation, regression, comparison, etc. Businesses employ this method to understand the underlying causes and unusual patterns behind a sales drop or sudden performance change.
-
Predictive Analytics
As the name suggests, Predictive Analytics deals with forecasting possible outcomes based on insights and patterns from current and past data. It helps companies foretell customer behaviors, future trends, and possible risks.
-
Prescriptive Analytics
Prescriptive Analytics answers the most critical question of every business, i.e., What to do next? It helps companies filter the available options for finalizing the best course of action to manage future challenges and opportunities. Companies often use it to fine-tune their pricing changes, work schedules, management, customer experience, personalized content, etc.
Benefits of Data Analytics
Data Analytics is now an indispensable part of every major industry, including e-commerce, governance, banking, and finance, among others. It provides a lot of key benefits to businesses, helping them adapt to market changes and thrive over time.
-
Better Decision-making
With emerging technologies, trends, customer needs, and competition, making well-informed decisions is paramount to every business. Data Analytics helps companies reduce risk by discovering patterns, trends, and opportunities from raw data.
-
Increased Operational Efficiency
Data Analytics promotes operational efficiency by streamlining operations, work management, and strategies. It assists businesses in cutting down losses and boosting revenues by freeing up vital resources, automating manual tasks, and offering valuable insights into customer preferences and behavior.
-
Improved Customer Experience
Data Analytics aids companies in enhancing customer experience and satisfaction by facilitating personalized solutions, active problem-solving, and actionable insights. It offers solutions to cement customer loyalty and growth by analyzing past transactions, behavior, and responses.
-
Risk Management
Data Analytics gives real purpose and strength to decision makers across industries by presenting potential risks, their impact, and methods to mitigate or prevent them. Further, it also extends the leverage of appraising previous risk management strategies by dissecting historical data.
-
Revenue Growth
Data Analytics can play a pivotal role in shaping your financial strategies with decisive insights into budget allotments, cost management, and new revenue sources. It provides businesses with ways to use and adopt demographic data for framing more effective marketing strategies. Also, it offers a road map to improve revenue and profitability with shorter lead times, price optimization, customer satisfaction, better staff engagement and retention, higher productivity, and sustainability.
-
Competitive Advantage
Data Analytics is the most practical approach to gain a competitive advantage as it supplies businesses of all sizes with a 360-degree awareness of their environment. It unravels new opportunities with meaningful data insights for business innovation, ideal resource management, and long-term strategies for sustainable growth.
How Does Data Analytics Work?
Data Analytics begins with professionals such as analysts, scientists, and engineers working together to create data pipelines, which are used to set up a data model and analyze data based on it. It involves the following steps:
-
Data Collection
The process kicks off with collecting raw data from different sources, including websites, surveillance, personnel, surveys, apps, or chatbots. The collected data is then classified by demographics, age, income, or gender as per the business requirements.
-
Data Cleaning & Preparation
The second step is centered around finding errors, wrong entries, missing values, or repetitions, as accurate data outputs more accurate and practical outcomes. The data is cleaned by fixing errors, removing unnecessary information, and finally organized into datasets for analysis.
-
Data Exploration & Analysis
The statistically organized data is now explored and analyzed with the help of tools like Python, Power BI, Tableau, Excel, R, SQL, etc. Data analysts search for applicable patterns, trends, or information that can help solve problems and answer questions.
-
Data Visualization
The examined data is translated into simple charts, plots, graphs, infographics, or animations, making it easier to draw inferences.
-
Reporting & Decision-making
The gathered insights are then reported to stakeholders, helping them grasp key takeaways and make data-directed decisions with the knowledge of risks, opportunities, and strengths.
Challenges in Data Analytics
Data Analytics can revolutionize a business, forming a robust foundation for making data-driven decisions. However, planning, implementing, and concluding data analytics is challenging and demands large-scale efforts and time. It is not raw data that is useful, but the analysis of the data done scientifically. As data sources are often optimized for storage and not analytics, businesses struggle to harness large datasets without a well-framed strategy. The following are the common challenges faced by companies in undertaking Data Analytics.
-
Data Quality Issues
Oftentimes, the gathered data suffers from incompleteness (missing values), discrepancies (typos, wrong info), inconsistencies (mismatched formats, syntax), expiry, low veracity, and duplication, leading to imprecise insights. Data validation, cleansing, standard governance policies, profiling, auditing, etc., are commonly used to refine and streamline data.
-
Data Integration
Poor quality, siloes and fragments, differences in format, along with the sheer volume and velocity of data, make data integration challenging. Additionally, companies often face issues like scalability, compatibility, incorrect data leads, security risks, and a lack of awareness. Centralizing and optimizing data is an effective way to neutralize the challenges in data integration.
-
Data Security & Privacy
Data is power. Data is a resource. Data is everything. Hence, protecting sensitive data is a foremost responsibility for any business today. Companies sweat to combat cybersecurity threats (unauthorized access, breaches, & malware), data privacy regulations, and accidental & intentional data leaks while ensuring adequate data access and privacy. The solutions include choosing competent data integration platforms, implementing real-time data monitoring, utilizing data masking techniques to guard PII, updating protection mechanisms regularly, and following protection regulations.
-
High Costs & Infrastructure Needs
Data analytics requires huge investments in human capital, technology, and infrastructure, which is why IT teams often work hard to justify the costs. The simplest way to address this issue is to deploy a cloud-based data analytics platform, eliminating capital expenditure and ownership costs. And, the more insightful the data is, the more speedy and profitable the organization’s ROI is, as it helps companies remodel operations, marketing, and supply chains.
-
Scalability
As data volume grows, guaranteeing resources to support AI models is crucial. The demands for hardware and software upgrades become critical to manage memory limitations, I/O restrictions, resource utilization, and processing bottlenecks at every step of data analytics. The usual approaches to tackle scalability issues include employing data partitioning and sharding (datasets are distributed across multiple computing platforms), load balancing, cloud-driven resources, and microservices.
-
Timely Data Processing
Timely data processing is a phenomenal task given the sharp data velocity and volume, low-latency, data quality, and consistency demands. Most businesses adopt stream processing technologies like Spark, Apache Kafka, Apache Flink, etc., unified semantics, automated data validation and quality checks, and cloud-based infrastructure.
-
Handling Large Datasets
Handling large data often includes storing, transferring, and backing up massive and varied data for analysis. Businesses find it difficult to cope with the data velocity in real-time. Sustaining data veracity while protecting sensitive information and finally integrating data from multiple and distinct sources burdens them more. Popular measures include optimizing infrastructure, selecting a dependable engine, proper management of data types, chunked data reading, and vectorization. However, organizations with limited budgets switch to scalable cloud-storage solutions like Google Cloud, Microsoft Azure, Amazon S3, etc., and data integration tools such as Talend, Apache NiFi, Informatica, etc.
Top Open-Source & Self-Hosted Data Analytics Software:
1. Apache Spark
Apache Spark is a multi-language platform that offers several advanced features for executing ML, data science, and data engineering on single nodes or clusters.
Key Features:
- Supports both batch and stream processing
- Executes distributed ANSI SQL queries for ad-hoc reporting and dashboarding faster than data centers.
- Capable of petabyte-scale Exploratory Data Analysis with freedom from downsampling
- Adopts the code you build on a laptop, scaling it to redundant clusters with thousands of machines.
- Offers intuitive APIs allowing users to write applications and programs in several popular languages – Java, SQL, Python, Scala, R, etc.
Benefits:
- Flexibility and continuous updates with an open-source framework supported by an active community worldwide
- Speeds up applications 100x in memory and 10x on disk by permitting applications to run on a Hadoop cluster.
- Runs on all cutting-edge platforms, including Kubernetes, Hadoop, Mesos, Standalone, and the Cloud
- Empowered by a platoon of libraries for Dataframes, MLlib, SQL, etc.
- Built to run multiple high-end workloads like real-time analytics, ML, interactive queries, and graph processing.
2. Apache Hadoop
The Apache Hadoop software library is a framework for distributed storage and processing of large datasets across different clusters via simple programming models.
Key Features:
- Supports Hadoop Distributed File System, allowing individual nodes to function on locally shared data, with the benefits of low network latency, high throughput, and no schema pre-requisite.
- Integrated with YARN to effectively schedule user applications and allocate resources in clusters
- Processes large-scale data by combining individual subsets into a manageable dataset driven by MapReduce.
- Features optimized architecture for distributed computing, which enables parallel processing across multiple nodes with fault tolerance and high data availability.
- Enforces enterprise-grade security with Kerberos authentication, user and group-based access management, and data encryption
Benefits:
- Integration with Apache Spark, Flink, Storm, and Hadoop’s ecosystem of tools
- Support for ML processes like classification, clustering, and recommendation
- Automated task distribution
- Dual NameNodes to prevent single-point failure
- Scalable architecture that allows adding more commodity machines, as an alternative to a cost-critical hardware upgrade
- Extended community support – Regular updates, a wide pool of how-tos, tutorials, forums, blogs, etc.
- Format-flexible framework for multi-format analytics and ETL workflows.
3. Presto / Trino
Presto, also popular as Trino, is an SQL-based distributed query engine for big data analytics.
Key Features:
- Its single ANSI SQL interface enables you to handle all your data in multiple siloed data systems for a unified data ecosystem.
- Establishes resilient security with CLI Kerberos Authentication, LDAP Authentication, Password File Authentication, Built-in System Access Control, and Secure Internal Communication.
- Presto is multi-tenant, flexible, adaptive, and extensible, making it perfect for both interactive and batch workloads, small and large datasets.
- Its Connector architecture allows you to query vast data from wherever it is stored – NoSQL databases, Hadoop environments, open-source and private RDBMSs, data lakes, lakehouses, stream processing systems, and beyond.
- Ships with JDBC support and complies with industry-grade BI and query authoring tools.
- Supports major open-source file formats, including Parquet, ORC, and Avro.
Benefits:
- Built with various features, such as code generation.
- Invented at Meta, Presto operates more cost-effectively and productively as it is optimized for numerous small queries. It can scale up or down flawlessly to meet growing data volumes and workloads.
- Capable of handling data analytics (analysis, aggregation, and reporting) and data warehousing.
- Supports multi-hour ETL jobs that manage TBs of data and user-facing reporting applications with split-second latency demands
- Versatile design suitable for interactive analytics, developer/advertiser analytics, high-performance dashboards, SQL interface to internal NoSQL systems, and A/B testing infrastructure.
4. ClickHouse
ClickHouse is a column-oriented open-source DBMS built to generate real-time analytical data reports using SQL queries.
Key Features:
- Its column-oriented design allows creating tables and databases, data loading, and executing queries without reconfiguring and restarting the system.
- Provides special codecs for unique data types, enabling advanced data compression
- Facilitates parallel processing of large queries on multiple cores, for maximum resource utilization.
- Supports SQL-based declarative query language compatible with the ANSI SQL standard
- Embedded with the Vector computation engine to achieve higher processing efficiency by storing data not only in columns but also in vectors.
Benefits:
- Allows you to physically sort the data by primary key, making it possible to filter and extract data based on exclusive values or a range with millisecond latency.
- Supports distributed query processing on multiple servers, permitting data storage on different shards for fault tolerance and transparency.
- Enables you to add data in real-time
- Integrated with support for secondary indexes, aka data skipping indexes
- Suitable for online queries with split-second latencies
- Employs multi-master replication with automatic/semi-automatic recovery options
5. Apache Superset
The Apache Superset is a cloud-based open-source platform designed for data exploration and data visualization.
Key Features:
- Offers more than 40 pre-installed visualizations with customization support.
- Supports SQL queries and drag-and-drop analytics
- Integrated with Data coaching for speedier loading of dashboards and charts
- Enables the creation of interactive dashboards with Jinja templating and dashboard filters
- Supports writing custom SQL queries
- Extends physical and virtual datasets for ad-hoc data research with unified metric definitions
Benefits:
- Utilizes CSS templates for brand-based customization
- Provides drill-by, drill-to-detail, and cross filters for deeper data analysis, and a semantic layer for SQL data transformation.
- Supports a variety of databases, including PostgreSQL, MySQL, Snowflake, Google BigQuery, Amazon Athena, Druid, Databricks, etc.
- Suits diverse use cases with a user-friendly, lightweight, fast, and intuitive design.
- Can connect to any SQL-based database at the petabyte scale.
6. Metabase
Metabase is an open-source Business Intelligence engine that empowers users to explore and evaluate their data on their own.
Key Features:
- Embedded with a native query editor to write questions in the database’s native language.
- Its AI-powered data assistant, Metabot AI, allows you to query, generate, and debug SQL, automate written summaries, and more via simple commands in plain English.
- Let’s you create interactive dashboards where you can arrange questions and models into tabs and contextualize them with link cards, Markdown text cards, and iframe cards.
- The in-built analytics SDK permits you to set up custom integrated analytics with full control over prototype and style.
- Features an Intuitive segment called ‘Usage Analytics’ which assembles dashboards, questions, and models for handier insights into data processing in your Metabase, performance, and configuration changes.
Benefits:
- Supports a multitude of databases and ships with a demo database for you to rehearse and learn
- Quicker ad-hoc analysis with the option to upload CSVs
- Data segregation support to restrict and grant access in a flexible and secure manner
- Allows you to customize how Metabase manages each field, setting your preferences in field visibility, formatting, type, etc.
- Helps you create models using metrics and data from various tables as a reference to ask new questions and create reusable calculations.
7. Grafana
Grafana is a composable, open source analytics and monitoring tool that allows you to visualize, query, explore, and notify on your logs, metrics, and traces anywhere.
Key Features:
- Features Command Palette for acquainting yourself with the Grafana UI through simple commands on the keyboard
- Let’s you set, access, and alter permissions allotted to default roles such as Viewer, Editor, Admin, specific teams, or users through RBAC.
- Supports the use of chained variables to create a cascading set of filters that help you steer down to the exact data you are looking for.
- Grafana’s Infinity data source plugin helps you connect your Grafana to any third-party application and seamlessly visualize diverse data. It also adds the ability to process a diverse set of data formats – CSV, JSON, XML, GraphQL, and HTML.
Benefits:
- Built-in live streaming without an external data source via Grafana Live
- Offers you an on-the-spot overview of your data in several panels based on the analysis of your data and query context, with Intelligent visualization suggestions.
- The public dashboards enable sharing the latest data from your dashboard with anyone, even outside of your organization.
- The Plugin Catalog facilitates the installation of plugins without the need to restart and reconfigure, striking out the complexity.
- Supports a variety of data sources such as Prometheus, InfluxDB, Datadog, Graphite, Elasticsearch, MSSQL, etc.
- Robust security strengthened by industry-standard compliance, administrative UI, MFA, Users and Permissions management, and so on.
8. KNIME
KNIME is a data analytics tool based on highly available, codeless, drag-and-drop programming for building data workflows from simple to the most complex.
Key Features:
- Support unique data functions and more than 300 integrations, enabling you to import, merge, and work with data from varied sources.
- Allows you to integrate custom C, Python, R, SQL, or Java scripts
- Provides an automated drag-and-drop interface for full command over data.
- Offers you transparency and insights into how your data is processed at each step with visualized workflows.
- Built-in extensions and workflows for on-the-spot analysis without starting from scratch. The extensions facilitate advanced analysis like geospatial analysis, cheminformatics, time series analysis, weather data, predictive modeling, etc.
- KNIME’s AI assistant, K-AI, at disposal, for building new workflows based on text commands, queries, solutions, and help
Benefits:
- Centralized management and resources for interactions across organizations
- Support for the latest LLMs.
- Simplifies data analysis, transformation, and visualization to a ground-breaking scale with multiple pre-built nodes.
- Deployable for multiple use cases, including data sorting, ML, ETL, pipelines orchestration, advanced AI, gen-AI augmented workflows, and so on.
- Let’s you focus on multiple important metrics – revenue, cost cuttings, etc., for saving time and money with faster decisions.
- One solution to multiple challenges – data management, AI governance standards, workflow automation, creating a repository of regulated workflows and components, etc.
9. Jupyter Notebook
Jupyter is a web-based application for creating, organizing, and sharing computational documents that contain narrative text, live code, visualizations, and equations.
Key Features:
- Supports more than 40 programming languages
- Documents, aka Notebooks, can be shared with others via Dropbox, email, GitHub, and Jupyter’s Notebook Viewer.
- Provides rich and interactive outputs, including visualizations (images and videos), HTML, LaTeX, and custom MIME
- Facilitates stepwise code execution in real-time
- Supports multiple add-ons and interactive widgets
- Allows you to deploy your documentation right next to your data for unified management via JupyterHub.
Benefits:
- Offers a simple, streamlined, document-centric experience.
- Designed for centralized deployment and access
- Supports PAM, OAuth, and custom directory service systems.
- Extends the potential of big data with support for Apache Spark, Scala, R, Python, and visualization packages such as pandas, ggplot2, scikit-learn, and TensorFlow.
- Proficient at serving diverse needs and use cases such as Text analysis, NLP, ML models, data science workflows, creating slide displays and reports, etc.
- Includes Docker and Kubernetes support for seamless scalability, isolation, and simplified software installation.
10. RStudio
RStudio, created by Posit PBC, is an Integrated Development Environment for R and Python, which allows users to write code, check the outcome, and monitor the variables live.
Key Features:
- User-friendly interface with support for writing, saving, and retrieving reusable programs with R Markdown Vignettes
- Easier access to all newly created objects and imported data, including variables, functions, etc.
- Extends solution-oriented assistance in simple clicks
- Offers an Add-ins menu with an option to execute R functions effectively and interactively from within the IDE
Benefits:
- Support for code autocompletion
- Plot snippets to preview work under any phase
- Simplified terminal and console switching
- Access to work history
- Extended resources such as videos, documents, and tutorials on common queries, problems, tips, and tricks, etc.
Supported Workloads & Infrastructure Configurations
| Software | Workloads | Specifications |
|---|---|---|
| Apache Spark | Distributed ETL, batch & stream processing, ML, data engineering |
16–32 cores (Xeon/EPYC) 128–256 GB RAM 2–4 TB NVMe SSD + HDD for HDFS Cluster-ready, memory hungry |
| Apache Hadoop | Distributed storage & processing, large batch workloads |
16–32 cores 128–512 GB RAM 4–10 TB (SSD + HDD mix) Needs multiple nodes for scale |
| Presto / Trino | Fast SQL analytics on data lakes & warehouses |
8–16 cores 64–128 GB RAM 1–2 TB NVMe SSD Optimized for fast SQL queries |
| ClickHouse | Real-time analytics, high-throughput OLAP queries |
16–32 cores 128–256 GB RAM 2–6 TB NVMe SSD High disk I/O throughput |
| Apache Superset | Dashboards, BI reporting, data visualization |
4–8 cores 16–32 GB RAM 200–500 GB SSD Works fine on mid-tier servers |
| Metabase | Self-service BI, business dashboards & reporting |
4–8 cores 16–32 GB RAM 200–500 GB SSD Lightweight BI tool |
| Grafana | Monitoring, observability dashboards, alerting |
4–8 cores 16–32 GB RAM 200–500 GB SSD Often paired with Prometheus/Elastic |
| KNIME | Visual workflows, ML pipelines, data prep |
8–16 cores 64–128 GB RAM 500 GB – 1 TB SSD Handles ML pipelines |
| Jupyter Notebook | Data science notebooks, experimentation, prototyping |
4–8 cores 16–32 GB RAM 200–500 GB SSD Add GPUs if deep learning needed |
| RStudio | Statistical analysis, R & Python dev, reporting |
4–8 cores 16–32 GB RAM 200–500 GB SSD For statistical workloads |
| Software | Workloads | Recommended VM Configuration |
|---|---|---|
| Apache Spark | Cluster node for big data |
vCPU: 8–16 RAM: 64–128 GB Storage: 500 GB – 1 TB SSD |
| Apache Hadoop | Data node / Name node VM |
vCPU: 8–16 RAM: 64–128 GB Storage: 1–2 TB SSD + HDD |
| Presto / Trino | Query engine VM |
vCPU: 4–8 RAM: 32–64 GB Storage: 250–500 GB SSD |
| ClickHouse | OLAP workloads |
vCPU: 8–16 RAM: 64–128 GB Storage: 1–2 TB SSD |
| Apache Superset | BI dashboard VM |
vCPU: 2–4 RAM: 8–16 GB Storage: 100–200 GB SSD |
| Metabase | Small BI teams |
vCPU: 2–4 RAM: 8–16 GB Storage: 100–200 GB SSD |
| Grafana | Monitoring & dashboards |
vCPU: 2–4 RAM: 8–16 GB Storage: 100–200 GB SSD |
| KNIME | Workflow automation VM |
vCPU: 4–8 RAM: 16–32 GB Storage: 250–500 GB SSD |
| Jupyter Notebook | Data science dev environment |
vCPU: 2–4 RAM: 8–16 GB Storage: 100–200 GB SSD |
| RStudio | Statistical analysis VM |
vCPU: 2–4 RAM: 8–16 GB Storage: 100–200 GB SSD |