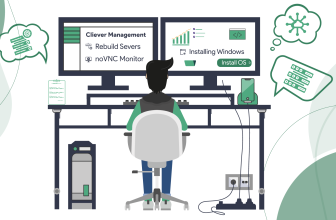
Top 10 Server Monitoring Software and Tools in 2023

What is the Meaning of "Server Monitoring"?
Servers are at the core of IT infrastructure and server monitoring is an integral part of IT. Server monitoring is a process of gathering numerous metrics regarding various server operations such as uptime, error rates, thread count, system level performance, RPS (Requests per Second) and data from storage and networking systems. It also involves monitoring of server resources like CPU utilization, RAM consumption, I/O performance, storage utilization, networks and others in real time. To run a server with maximized and efficient performance, it requires constant monitoring and care. Server monitoring is important because failing to do so will result in frequent downtimes, interrupted workflows, and cause crucial business losses. Regular server performance monitoring also aids in understanding resource utilization and adjusting server capacity.
Server management tools help detect problems and discrepancies in performance or resources. It flags corrupt files, errors, security threats, RAM performance and other issues that need to be attended to. It can also predict disk capacities, memory-related issues and such. The information saved from the past reports can be used for real time data processing. Using the server’s past data, the performance can be assessed over a particular period of time. It can also help in predicting and preventing future crashes and anomalies.
What is the Role of Server Monitoring Software?
A server that is slow or regularly inoperative causes downtime that affects the IT infrastructure and results in client dissatisfaction and a failed server ultimately leads the company to lose money. No business wants that to happen. That’s why IT companies need server management and monitoring tools and software.
Here are a few common features of a server monitoring software
Hardware Health Tracking
It helps to collect hardware health data which is generally available through Server OSes. It allows automatic monitoring of health across numerous nodes.
Asset Inventory
Schedule creation of multiple inventory files through polling of data across various nodes.
Real Time Tracking
Monitor all your server resources in real time to notice any changes, unauthorized access, and security threats.
-IP/TCP traffic monitoring- Monitor network issues and TCP connections and improve network quality and TCP connection response.
Docker Monitoring
As many companies adopt Docker containers with the need for growing application delivery, monitoring the cloud-based environment becomes absolutely crucial.
What Kinds of Resources Can Be Monitored?
The software is structured to monitor and gather metrics on server health and applications, availability and performance, to optimize uptime and minimize downtime. In general, the software tracks resource utilization as discussed above, like RAM and CPU usage, response time, bandwidth usage, user load and availability. Here are the key components that are commonly monitored.
CPU
The CPU usage is can be high as it handles all computations, I/O operations, and other server components. Thread count, processor type, process count, interrupt time, and other metrics can be monitored. CPU utilization shouldn’t be peaking above frequently, anything above 70 percent or close to the maximum values when during non-peak periods indicates a sluggish server performance.
Disk Usage
Storage and bottleneck issues can be reduced when disk usage is monitored regularly. When an increased number of users access the same applications with a particular storage disk or location, it might cause problems. Above the maximum storage usage, the system crashes and becomes slow. Monitoring storage also helps clear clutter and scale storage when required.
Errors
Systems errors are common but when they are left unattended they will lead to major problems. Corrupted files, operating system and application errors, DNS errors, service failures, etc. can be detected through software monitoring software. An error rate less than one percent indicates a good performance.
Firewall
Monitor all firewall metrics and make the servers more secure monitoring and analyzing traffic, bandwidth, and network sessions. The software monitors firewall logs, configurations, alerts, updates, and rules to safeguard against network attacks and cyber threats. One such tool would be a Firewall analyzer that shows all firewall-related activities on configured devices.
Network
Keep in check all your network connections through a simple dashboard. Track network bandwidth, throughput, and the network traffic. Monitor the inbound and outbound packet errors, output queue lengths, kilobytes, etc. SAN component issues if occurring at multiple points can be detected. Since a SAN server is capable of hosting various applications on multiple sites, any significant downtimes can be prevented.
RAM
Faults per second, free memory, page reads, writes per second, pool paged bytes, etc. can be monitored. Users can monitor RAM utilization and server monitoring can display the maximum limit. It can give an indication to adjust your RAM to prevent crashing by adding extra RAM or scale RAM horizontally.
Top 10 Server Monitoring Software and Tools in 2022
MetricFire
Metricfire is a dependable open source network monitoring tool that provides a full scale platform for application and IT monitoring. MetricFire can help build customized dashboards as it allows the use of Prometheus or Graphite-aaS. This tool arranges the metrics into an easily analyzable dashboard. The smart automation of Metricfire automates and modifies the required features using inbuilt API.
Pros
- MetricFire offers long-term storage
- DIY dashboards
- Technical support and alerts.
Cons
- Advanced features are difficult to configure
- Requires Technical help
PRTG
Now accessing network traffic, memory uses, and event logs is simplified with PRTG. This tool assesses event logs so that you can fix any underlying issues. PRTG provides a proper assessment of various servers and databases. Operate securely with Windows security management and log management.
Pros
- Simple Customization and configuration
- Provides Overall monitoring solution
- Performance counter, WMI and SNP.
Cons
- Difficult to set up and change
- Old configuration interface with lag time
- Increased triggers
Zabbix
A flexible infrastructure monitoring tool that can monitor a wide range of IT components, including big cloud environments, networks, and others. It also provides metrics for disk space consumption and CPU load. The API it provides helps in creating new applications and automating tasks. It also integrates with third-party software which enables better extensibility and access to Zabbix’s monitoring data and features.
Pros
- Enables agent and agentless monitoring.
- Supports cloud or on premises.
- Capacity Planning
Cons
- Professional help is required for the configuration
- Implementation is difficult.
Sematext Monitoring
Among the efficient hardware monitoring tools, Sematext offers a unified and simplified dashboard to control your servers, applications and multi-cloud environment stacks. Gain meaningful insights and effective solutions with quick troubleshooting, regular anomaly detection, and constant updates.
Pros
- Anomaly detection and alerting
- Correlate metrics between applications performance, log analytics and database traces.
- Simple GUI based metric and Log aggregation setup
Cons
- Old agents missing documentation and limited transactional tracing.
- For sending custom metrics, specific integrations are not ideal.
Prometheus and Grafana
Prometheus and Grafana are two of the top most open source network monitoring tools. Prometheus requires data gathering agents called exporters in large amounts to send metrics and these metrics can be used to create DIY dashboards with Grafana. There will be no shipping of metric to a third party vendor as Prometheus runs on the client’s infrastructure.
Pros
- Slew of available exporters can be exported to Prometheus.
- A potential Open source tool with flexibility, excellent performance and custom metric support.
Cons
- Requires skill in configuration and customization
- Requires manual set-up and expert help
SolarWinds Server
For hybrid and virtual cloud environments Solarwinds server is a reliable management tool. It establishes a relation between the clients application performance metric and server usage metrics. Its features include automatic server services monitoring, server health check, server process, inventory monitoring, etc. It’s a valuable hardware monitoring tool that prevents hardware malfunction and failure.
Pros
- Solarwinds provide coverage for databases and applications with alerts.
- 1200 plus dashboards.
- Correlated metric with End-to-end support and capacity planning recommendations.
- Application dependency mapping and automatic service discovery.
Cons
- Dashboard with Limited and common reporting filters.
- Alerts do not have anomaly detection
- Solarwind doesn’t provide support for identity federation with LDAP.
Dynatrace
Dynatrace is one of the best in the race which is accessible in on-site and Saas models, a simple-to-use tool that can easily stream all the metrics into informative dashboards. Analyze and monitor your CPU, memory, and network health even at the process level. Dynatrace can evaluate performance and availability issues and also the specific pf application architecture using its smart AI.
Pros
- The operations overhead is minimum.
- Dynatrace provides anomaly detection and alerts
- An all-in-one tool for IT, cloud automation, application performance and analytics etc.
Cons
- Require trained staff, slightly complex in configuration.
- The dashboard has limited functionalities.
- The latest updates are lagging in documentation.
Datadog
To monitor performance metrics and events occurring in applications, IT, cloud, and other platforms, Datadog is just right. AWS, Azure, Kubernetes and more than 450 integrations are supported by Datadog that uses an API. Datadog can automate correlations and log data tagging and provides a unified view of these metrics.
Pros
- Debugging performance issues can be identified through monitoring of correlated metrics and server log discovery.
- Log and analytics aggregation support.
- Datadog proactively detects anomalies and alerts.
Cons
- New users require help to navigate and configure.
- Lack of support for JSON log processing limits log analytics.
- It doesn’t provide a self-hosted situation.
AppDynamics
For monitoring storage and network components, AppDynamic provides a full-stack observability platform. AppDynamics works with hybrid and cloud environments, on-premise or as SaaS. It uses a set of APIs to collect and analyze data from third-party agentless services and open sources. It collects information from server components and arranges them into a dashboard.
Pros
- Immediate incident management integration and alerting systems like PagerDuty, Jira etc.
- Detail oriented monitoring.
- Auto-remediation and anomaly detection.
Cons
- Unavailability of self hosted version.
- Tutorials and documents are short on supply.
- Assistance required to navigate advanced features.
Nagios XI
Nafion XI is another reliable open IT software monitoring tool capable of handling enterprise servers. The administration time and functionality is quite less and it mainly focuses on server metrics, network traffic, and application performance. Using SNMP and WMI protocol, Nagios XI connects to server components or network switches by querying the components status and gathers data from Windows-based protocol.
Pros
- Easily customizable and customer metric support.
- Since it’s initially designed to run Linux and its variants it easily monitors Linux and also Windows.
Cons
- Operational and maintenance overhead.
- Default dashboards are restricted.
- Not user friendly, requires expert help.
How to Choose the Right Server Monitoring Tool for My Organization
You can choose from a wide range of SaaS and open-source server monitoring tools. To pick the correct tool, it’s important to understand your business requirements. Listed below are some of the common key features.
Less Configuration Overhead: The software and tools should be easy to set up, configure, and require less maintenance. It should be able to cover all your needs in its default dashboard and alerts.
Anomaly Detection: The software should be able to detect and automate the alerts with the help of its resourceful AI.
Metric Coverage: Choose a tool that can efficiently collect data and analyze it with minimum errors. You should be able to configure the metric that needs to be monitored.
Correlation: It should maintain a balanced correlation between various metrics and make it easy to identify the root cause of an issue.
Control Over Access: To make the access more secure, it should have fine tuned access/authorization, and access management.
Total Cost of Ownership- For enterprise-level monitoring, on-premise can be expensive but SaaS-based solutions which are popular today reduce the complexity and operational overhead. Either way, choosing a software that integrates well and reduces operational costs and errors is important.